Guest

Ian Morris
Stanford University
Hosted by

Joanne J. Myers
Former Director, Public Affairs Program, Carnegie Council
Ian Morris demonstrates that social development can be measured across thousands of years. Based on past trends, what can we expect in the future? For one thing, the pace of change has accelerated. Morris predicts that the 21st century is going to be a "race between shifts in the balance of power, a transformation of humanity, and catastrophe."
JOANNE MYERS: Good morning. I'm Joanne Myers, director of Public Affairs Programs, and on behalf of the Carnegie Council I'd like to thank you all for joining us.
Our speaker is Ian Morris, and the subject of his presentation is The Measure of Civilization: How Social Development Decides the Fate of Nations.
During Ian's last visit, about three-and-a-half years ago, he explained to us why the West rules—for now. What I remember from that program is his wit, humor, and treasure trove of information, as he explained to us why some countries flourish while others flounder. If that morning is any indication, I believe we can anticipate another exciting discussion. It is a pleasure to welcome him back to the Carnegie Council.
Drawing from his own experiences as an archaeologist, vast knowledge of a historian, and using the tools of a social scientist, he made it clear that if we really want to know why the West rules for now, we need to measure social development and compare it across the board. Or, stated another way, we could understand this better if we could assess a group's ability to master its physical environment in order to get things done. The reason I mention this is that his new book, The Measure of Civilization, is, as he has said, a companion volume to his earlier work, and, like all good companions, it not only supports and complements his Why the West Rules—For Now, but in this case cements his thesis by providing the evidence and methods that lay behind that story.
In The Measure of Civilization, Professor Morris writes that his mission is twofold: first, he tells us that he wants to provide the critics of the award-winning Why the West Rules—For Now with the ammunition they need to systematically analyze the approach and conclusions he reached; and secondly, he wants to contribute to making comparative history more explicit and quantitative.
While historians have offered endless explanations for the temporary preeminence of the West, Professor Morris not only gives us his interpretation, but he also presents what features of society matter most. Accordingly, we hear a lot about developments in energy capture, social organization, war-making capacity, and information technology that he draws upon to explain how social development determines what geography can, and actually does, mean in the long run.
Please join me in welcoming the one person I know who can seamlessly blend archaeology, history, and modern government data to tell us what we need to know in preparing for the future—and he does this all without skipping a beat—our guest today, Ian Morris.
RemarksIAN MORRIS: Thank you very much for that very kind introduction. It's great to be back here again.
I'm here to talk about this new book that Joanne just mentioned, The Measure of Civilization. The basic argument I try to make in this book is, as we all know, the past is not a very good guide to predicting the future. But it's the only guide we've got, so we need to try to make the best of it. The claim I try to make in this book is that we can identify long patterns in history and we can identify the forces that have driven human history, and once we've done that, we can use them to make some kind of projections, get some sort of sense of where we might be going in the 21st century.
I started working on these sorts of topics five or six years ago. I got interested in them because historians were increasingly moving to take up this great debate about why it was that a relatively small number of nations around the shores of the North Atlantic had taken over the whole planet really a couple of hundred years ago. This was becoming the big question among world historians. They weren't entirely sure why this was happening. They were very mystified, there was much argument about this. So I started getting interested in this and trying to figure out new ways to think about the problem.
The idea that became most popular, starting in the 18th century, was that there was something unique about Europe. There was a line of tradition going back to the ancient Greeks. Ancient Greeks created this unique civilization of wisdom and science and energy and all these fantastic things. It gets picked up and spread around by the Roman Empire, the Romans spread it all over Europe, it gets inherited, passed down to Europeans, until you end up at the pinnacle of Western civilization. So this is the basic argument. It has had a long run, very popular argument.
As I'm sure you also know, though, it has come in for an awful lot of criticism across the 20th century. People suggested this is completely wrong—particularly in the late 20th century, when the great East Asian economic boom really begins and people start saying, quite reasonably, "If this traditional story, the sort of Plato-to-NATO story—if that's true, how do we explain what is actually happening in the world? Something is wrong here."
So these intense debates get going. They often get very heated. Historians are very nice people, my colleagues, but we do have a tendency to be a little bit polemical and hostile with each other. They are often, I think, a little bit confused as well, in the sense that we don't all agree on what we mean by the words we use, the terminology. It can just get very, very messy.
So when I started getting interested in this, I thought that perhaps the most useful way to approach this problem would be some kind of quantitative way. It wouldn't necessarily make the debate more objective than the qualitative approaches, but it would make it more explicit. You could say exactly what you mean. You put a number on something, you have to be able to explain how you came to that number. It would just get the whole thing a little bit more in the open.
So it seemed to me, like Joanne was saying, that this big argument was really about what I came to think of as under the label "social development," by which I basically just meant societies' abilities to get things done. What I mean by social development is the bundle of technological, subsistence, organizational, and cultural accomplishments through which people feed, clothe, house, and reproduce themselves, explain the world around them, resolve disputes within their communities, extend their power at the expense of other communities, and defend themselves against others' attempts to extend their power. So it's an attempt at a broad snapshot of a group's ability to master its physical and intellectual environment. In principle at least, this is something that we ought to be able to measure, both through time and across space, and compare different societies.
Basically, these theories that go back to the 18th century, the Greece-to-the-modern-West tradition—these older theories usually imply that Western social development has been different from, higher than, the rest of the world for a very, very long time, going all the way back to the ancient world.
The newer theories that are contesting this old idea basically say that's not true. Western social development has either been lower than other parts of the world through most of history, or it has all been basically the same. But the basic idea is that something changed dramatically fairly recently, the last couple of hundred years, and before that there was no particular Western lead in social development.
These are basically quantitative claims, even though they have usually been pursued through more qualitative methods. It seemed to me the best way to address them was to try to measure social development across long stretches of time, compare Eastern and Western development in particular, and see which of the theories fits the reality better. So that's what I did.
The original idea was that I wrote this book that Joanne mentioned, Why the West Rules—For Now, that came out at the end of 2010. This was the narrative explanatory part of the argument, to construct this index of social development. It's lots and lots of details and graphs and charts and arguments about methods and what the evidence actually says. That just seemed rather heavy going. So we decided in this modern day and age, when we are all so enlightened, we should just put that up on the Internet. That is clearly the way people will want to access this.
Well, it turned out we were completely wrong. That was not the way people wanted to access this. To my slight surprise, it turned out there is a lot of interest in having this appear in a more developed form as an actual book.
Rob Tempio, a very good editor at Princeton University Press, suggested, "Why don't we turn the index into an actual book that people will be able to consult a lot more easily and use more?" So we did. This just came out a few weeks ago. This is what I'm here to talk about.
Basically, what I want to do with the rest of my time this morning is a pretty simple plan. I want to explain this social development index a little bit more, give you a sense of how it works, and then talk a few minutes at the end about what this might tell us about where the world is going. Even though I am employed to be a historian, I must say this is the bit I find most interesting, the idea that we can use the patterns in the past to get some sense of the direction the planet is going.
Obviously, I'm not the first person to have this idea. A very well-known part-time historian actually suggested this some time ago, Winston Churchill, who I'm sure you have heard of. Churchill said, "The farther backward you can look, the farther forward you are likely to see." I've always thought this was a very sensible insight into history. Particularly when I came to work on this problem, I realized that to understand social developments you need to look back a very, very long way indeed to see the big patterns, how they played out over long periods in history.
To do this properly, I felt you need to look back about 15,000 years, which is a pretty long time, all the way back to the end of the last Ice Age, because this is the point at which we begin to see really distinctively different kinds of societies emerging around the world, very, very different ways of living in different parts of the world.
At the end of the Ice Age there's a band of latitudes across the planet. The old world roughly runs from China to the Mediterranean, where it's possible for people to begin agriculture, domesticate plants and animals. These societies in this area begin to move into much more complex agricultural forms, they become much more powerful and sophisticated, and develop enormous differences between them. So, say, as you go from the Mediterranean world over to China, the societies are very, very different.
So I decided that to try to explain this long-term pattern of social development what I should do was look at the societies that start emerging about 15,000 years ago.
I call the ones that emerged at the Westernmost end of the band of lucky latitudes the Western societies. The ones that start in the area marked on this map here, if you can see the slides, is the hilly flats, basically southwest Asia. The ones that emerged at the easternmost end of this band—it seemed to me common sense—I call the Eastern societies. Each of these areas is a particular area after the Ice Age where agriculture begins, and then they spread out from there over time. The population grows, people move out, farming spreads.
Now, within each of these areas at any point in time there's always one place that is most developed, which has the most sophisticated things going on. So what I did was look across these 15,000 years comparing the core areas within each of these Eastern and Western zones and measuring their social development on my index and comparing them. That's the basic thinking behind what I was trying to do.
The obvious question, though, is how do you actually do that. It's easy to say all this. How do you actually do that?
I scratched my head for quite a while when I was starting down this road. Then I decided—the classic solution for an academic—when you're in doubt, copy what somebody else did. It turned out to be actually a very good idea for once. I would copy what the United Nations had done, a very fine group of people.
About twenty-some years ago, the United Nations decided in their wisdom it would be useful to have a Human Development Index. I'm sure many of you know a lot more about this subject than I do. As I understand it, the basic idea is it's a way to measure quantitatively how well governments are doing at creating conditions that allow their citizens to realize their innate human potential.
Obviously, they decided: "We want to have this. This will be useful for donors and all kinds of people if we have this. How are we going to do it? I know, let's hire a bunch of clever economists and tell them to do it." So that's what they did, they hired these economists.
The economists, very sensibly, say, "Well, what you mean by human development is this very, very broad, shapeless concept. You can't measure a broad, shapeless concept. So what you need to do is boil it down to the smallest number of traits you can, which, put together, roughly cover what you're interested in. But you want to make it the smallest number that you can and ones that have to be very measurable."
So the UN economists came up with three traits as a way to measure human development: life expectancy at birth, real wages, and educational levels. They then got into these intense arguments over weighting the different traits and what you do with other traits which might also be useful. It rages and it goes on and on and they all get very unhappy with each other.
Actually, I was just learning over breakfast that the new edition of the index just came out yesterday. So I'm behind the times, as usual. But now I have been caught up. So I will consult this, but I'm sure it's all going to be roughly the same as last time. Norway is always top, and that's just the fact of life. [Laughter] But anyway, they did this, and each year they issued a new updated version.
Now, this way of thinking about the problem, it seemed to me this was what I needed to do as well for my, frankly, rather different social development index. For the social development index, I am interested in this broader idea about societies, rather than individual humans, and it needs to be something where I can construct an index that runs through time, whereas the UN one each year is a separate snapshot.
So I thought about this for a while. It seemed to me that what I needed was four different traits, rather than the UN's three traits. Again, the idea is to find the smallest possible number that roughly covers the full range of what you mean by your central idea. The traits I came up with are:
• It seemed to me that for anybody who gets into this, the bottom line has got to be energy capture, how much energy per person societies are capturing.
• Then you need some kind of measure of organizational ability in the society.
• You need some kind of measure of information technology, how people can process information about the world, store it, communicate it to other people.
• And then last but, sadly, not least, there has got to be some kind of measure of war-making because violence is such a huge part of the story.
What I then did was work through these 15,000 years of history looking at these four traits, trying to quantify the evidence for East and West so that I could compare them. Each of these traits has got its own set of problems and peculiarities, as these things always do. But I think all four are roughly measurable within tolerable limits of error across the last 15,000 or 16,000 years.
So what I did was I looked at these, did the measuring, produced graphs covering the last 15,000 years, taking us up to the year 2000 A.D., which I use as a nice convenient round endpoint. For each trait, what I did, I said the overall social development score is going to be on a scale from one to 1,000 points, with 1,000 being the theoretically highest level of development possible in the year 2000 for each of the traits.
I have no particular reason to weight any one trait over another one. So I just avoided the whole set of problems the UN has had about weighting by just weighting them all equally, which may be wrong, but I don't see any other way to tackle this.
So for each trait it's possible to score up to 250 points. I took the highest level recorded on each of the four traits as being the equivalent of 250 points, which in most cases that score went to the Western world in the year 2000 A.D., although not always. That score gets 250 points. Then you can divide that number by 250 to find out what you need to score one point.
All this I always find explaining in the abstract gets a big confusing. So what I thought I'd do is I would just take one of my four traits and explain how I do that so you can see the basic way I'm going this.
I thought I'd take the organization one. Each of these traits, like I say, has problems. I think they all basically will. But each of them has ways they can be challenged and other people might disagree with the traits. This one I think is as good an illustration as any, and in some ways it's the easiest one to explain quickly.
What I did is I said, "I want some kind of measure of organization that I can measure over long periods of time. How am I going to do this?"
Here I borrowed another idea that some economists like to use, of using the largest settlement, the largest city, within a region as a rough proxy measure of the level of organization. There are obvious arguments you can make against doing this. The reason for doing it is that it clearly has some connection with organization, and it's something that can be measured across long periods of time.
My source for the city sizes was a fantastic source, The Economist's Pocket World in Figures. Wonderful book. I never leave home without it—actually I did this morning, but I wouldn't normally.
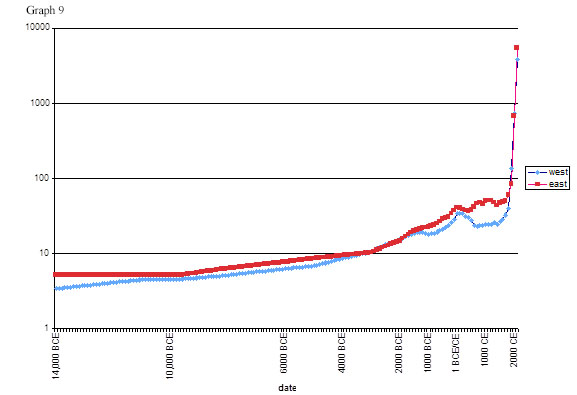
So what I did I started by looking at the year 2000 A.D. This is graph number 1 in the handout. Graph number 1, the red column represents the East, the blue column represents the West.
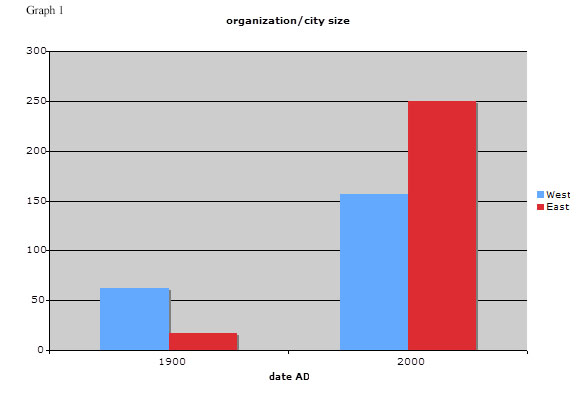
So 106,800 residents would get you one point on the index. The smallest unit of measurement I use is 0.01 social development points. So for every 1000 people or so at the biggest site, you get 0.01 points.
In the year 2000, which is the two bars over on the right-hand side of the graph, Tokyo is the biggest city in the world, population 26.7 million, and that scores 250 points. There are a lot of estimates of city size, but as long as you are using sensible ones they don't vary wildly for the year 2000. In the year 2000, New York was estimated at 16.7 million. That got you 156.37 points. That's what you see in the two right-hand columns, the red one for the East, the blue one for the West.
I then went back to 1900. I was measuring in one-century intervals. In 1900, London (the blue column), 6.6 million people, got you 61.8 points; Tokyo, 1.75 million people, got you 16.37 points. Again, that's the two columns on the left on this graph.
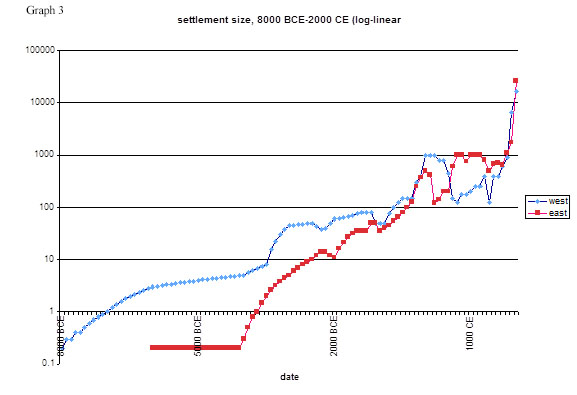
Then I just went all the way back. When you get to 4000 B.C., at that point in the Eastern world the biggest settlement is about 1,000 people, they get 0.01 points. Before 4000, the East scores zero on the organization scale, which is obviously a distortion of reality, but that's just a convenient way to work the scale. The Western scale goes all the way back to 7500 B.C.
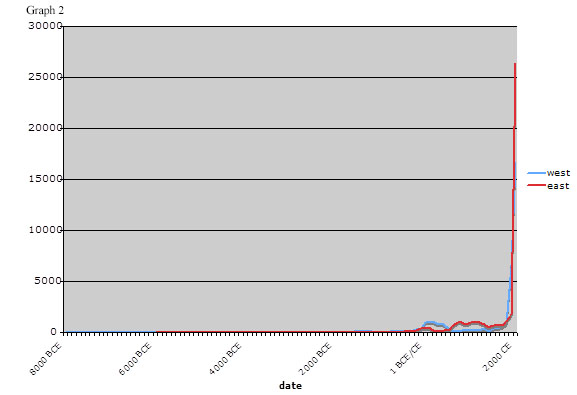
So I went through all this, calculating all these scores. Then you come up with this rather unimpressive looking graph. All my graphs are rather unimpressive. It goes on the bottom from 8000 B.C.—this is graph number 2 on the handout—to 2000 A.D., and then the settlement sizes on the vertical axis. The red line is East; the blue line is West.
This shows you exactly the same data on a logarithmic scale. Again, I'm sure probably nearly everybody will be familiar with this. This is graph 3 on the handout. Basically, the difference here is the vertical axis, each increment is 10 times bigger than the last increment. Say, if you want to graph your credit card debt, this is a fine way to measure how your personal debt spiraled out of control. [Laughter] It stretches out the lowest scores basically so you can see what's going on. It shows you the rate of change more than the absolute numbers.
This is what I did to calculate the organization scores on the social development index.
I then did the same kind of thing for each of the other three traits, bundled all four together to produce a single set of scores.
Now, to decide how well I do that, obviously what you need to do is buy my book and read it all the way through, and then you'll know the answers to everything. For now you're just going to have to trust me on this, I'm afraid, although you can tear me to pieces after, if you feel the urge.
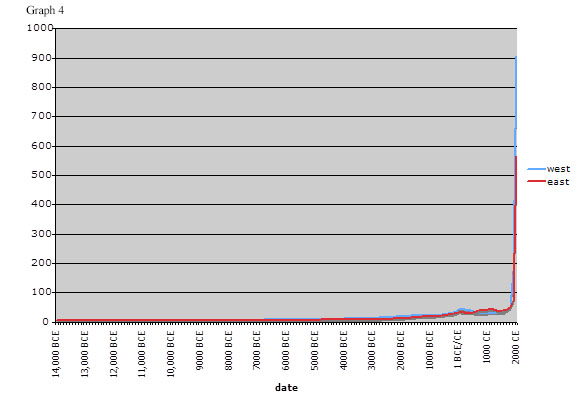
Having done that, what do we get, after calculating these traits, putting all the numbers together? We get graph number 4 on the handout. Again, a rather unimpressive-looking graph. Social development points up to a maximum possible of 1000 on the vertical axis, 14,000 B.C. to A.D. 2000 on the bottom. The red line is the East; the blue line is the West again.
Here it is again on a log linear scale so we can see a little bit more clearly what's going on. This is graph number 5 on the handout.
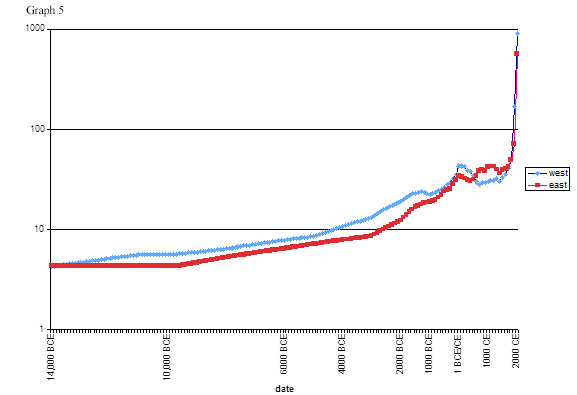
Now, I think we see some interesting things here. One thing we see is that the two lines are broadly similar to each other. They describe the same general sort of path through the graph. So any theories that see wild differences between East and West going back to the distant past, these are unlikely to be correct.
The second thing I think we see is the qualitative change in the scores in the last 250 years or so. The scores, even on a log linear graph, go almost vertical in the last couple of centuries. There is a great change there.
Another thing we see is that the blue Western line is ahead of the red Eastern line for something like 90 percent of the time since the end of the last Ice Age. This is a very, very deep historical phenomenon.
But on the other hand, the Western scores have not been higher than the Eastern scores the whole time. There's a 1,200-year period—so this is not a short period— between roughly the 6th century A.D. and the 19th century A.D., where the red Eastern line is clearly higher than the blue Western line.
We see that generally the development scores have risen since the end of the Ice Age—but not always. There have been periods then they stagnate, even periods when they decline.
That's what needed to be explained, I thought. In the book Why the West Rules—For Now, which I published a couple of years ago, I suggested that the explanation for these patterns basically lies in geography: geography determines social developments, but at the same time social development determines what geography means. So you get this sort of back-and-forth, rather complicated relationship. That's what I talked about last time I was here, so I will not go on and on about that.
This is basically what I found putting this index together. Fascinating technical difficulties involved in doing it. If you're the sort of person who likes doing this, this stuff is just obsessively interesting.
Basically, the core difficulty is we are moving from very fragmentary, broken bits of ancient stuff, most of it archaeological, digging this stuff and then trying to turn this into numbers on the score. There's obviously a lot of steps involved and a lot of room for controversy and argument.
The result of that is that if we are to ask "Is this graph (graph number 5 on the handout) correct?" the answer is no, the graph is not correct. I can tell you with 100 percent confidence I am wrong in my graph. But that's fine. Asking whether it is right or not, that's the wrong question to ask, I think. It cannot conceivably be right, that's just impossible.
The question we should be asking is, "How wrong is it? Is it so wrong that it leads us to misperceive the whole shape of the past, or is it close enough, which is all we are ever going to be able to do with this kind of work, close enough that it tells us something important?" Obviously, I think it's close enough, otherwise I wouldn't be standing here.
We can, I think, get a quick sense of that by saying, "What would happen if, say, I was systematically 10 percent off with all of my estimates?"
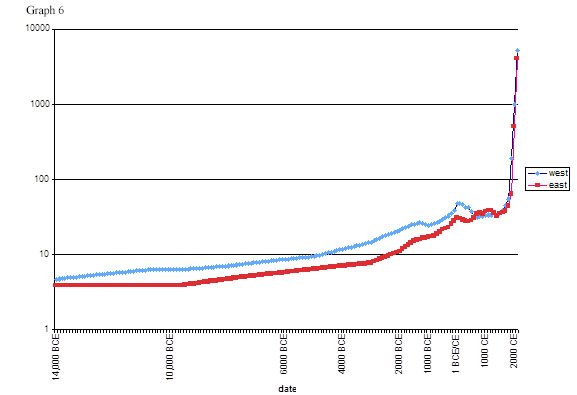
Let's look at this first graph here, number 6 on the handout. Let's say here that I've underestimated Western scores by 10 percent consistently and overestimated Eastern ones by 10 percent. This graph corrects that by lifting all the Western scores by 10 percent, depressing the Eastern ones by 10 percent. We end up with a slightly different pattern: the period when Western scores are higher is longer than the actual scores, but it's basically the same pattern we are dealing with.
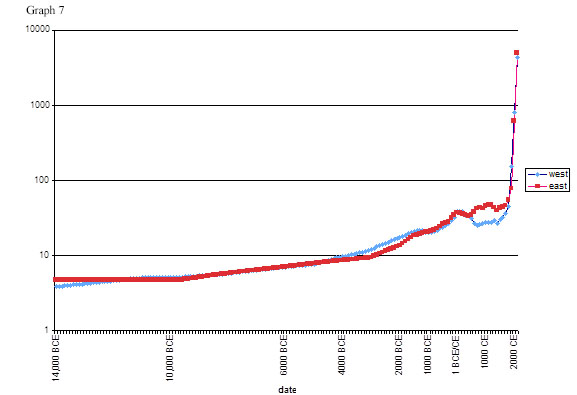
The next graph, which is number 7, does the opposite thing, raising the Eastern scores by 10 percent, depressing the Western ones by 10 percent. Again, it does make a difference. It narrows the period when Western scores have been higher, but we still get a graph where the Western scores have been higher most of the time since the end of the Ice Age. The same basic pattern seems to emerge.
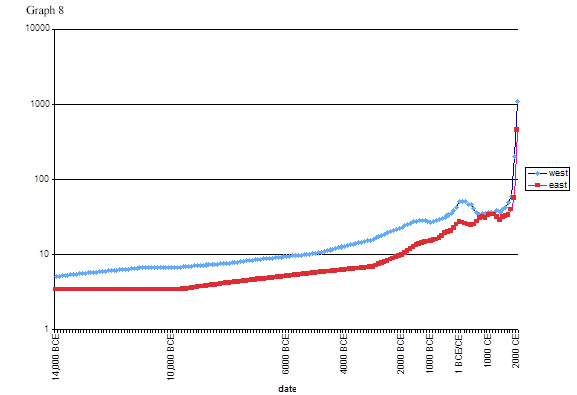
To make a real difference, what you've got to do is shift all the scores by 20 percent. What have we done here? Here we've raised the Western scores 20 percent, depressed the Eastern ones by 20 percent. On this graph Western scores are always higher than Eastern scores. So we are getting a rather different pattern. But the problem with this graph is that we can immediately see that this set of results is just insane. When you look at this graph, this graph is telling you that ancient Rome had a higher level of social development than Japan in 1900, which is impossible. This clearly cannot be right. The estimates I have made cannot be as much as 20 percent off.
This one shows you—again shifting the scores, raising the Eastern score by 20 percent, lowering the Western one by 20 percent—on this one the Eastern score is almost always higher, but it again implies things which cannot possibly be true. It would mean that the ancient Shang Dynasty in China around 1200 B.C. was more developed than the Persian Empire 700 years later, which cannot be right. It would mean that during the Opium War in 1840–1842, when the British fleet shoots up the Chinese fleet, that Chinese social development was still higher than Western social development at this point, even though Europe had gone through the first stages of the Industrial Revolution already. Again, this cannot possibly be right.
So I think we can quickly see that the scores are not 20 percent off. They might well be 10 percent off, but if they are, that doesn't really matter because the basic pattern will still hold good.
The last thing I want to talk about, what to me is the most interesting way to play around with these graphs, is to use them as the basis for thinking about what might be coming next.
There's a lot of different ways you can do this. The one that I found most useful is what we see in the last graph on the handout, graph 10. What I do in graph 10 is just look at the rates of change in development in East and West in the 20th century and say: What will happen if we just simply project these forward in a linear way? What would that show us?
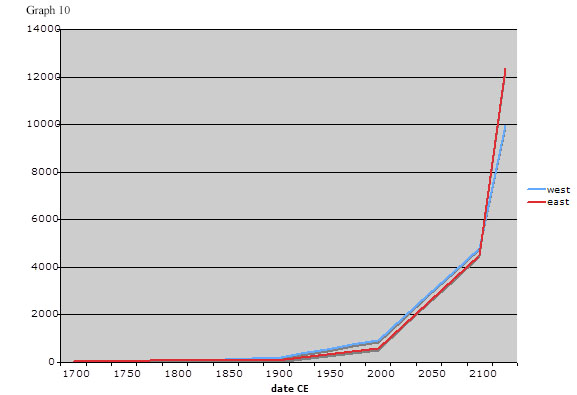
This is a very conservative assumption to make, because what we see in the first 12 years of the new century suggests that rates of development are accelerating, rather than just continuing in a linear way. But what will happen if we just project them forward?
This graph shows you projecting the lines forward out to 2150. The immediately obvious thing in this graph is you see the red line catching up with the blue line. I can now tell you with 100 percent confidence the East will catch up with the West in the year 2103. So make a note of that. A perfect prediction, by the way. It has everything a good prediction should have: it's precise, so if we get to 2104 you'll know I was wrong; also, by the time we get to 2104 I will be long dead so it won't matter whether I was right or wrong. So perfect in every way.
All it tells you, of course, is what will happen on the basis of a certain assumption, that the rates of growth continue at exactly the same rate. The consequence of that assumption is an Eastern catch-up with the West by the end of the 21st century.
But what I think is actually more interesting about the graph is not where these two lines meet when we're looking along the bottom axis, the dates, but where they meet if we look on the vertical axis for the social development score. The point at which they cross is roughly 5,000 points on the index.
In the year 2000, the highest score on the index is 906 points. So to get from the cave paintings at Altamira to the Carnegie Council, that costs you about 900 points. The implication of continuing at 20th century rates of change is that the following hundred years is going to see an increase of 4,000 points, four times as much change as we've seen since the end of the Ice Age, which is extraordinary.
Like I said, this seems to me to be quite a conservative set of assumptions I'm making here. If that's true, the 21st century is going to be the greatest discontinuity in the history of the world. The next hundred years will see more change than the previous 100,000 years, which is quite something.
However—there's always a "but" in these things—when we look back across the last 15,000 years of history, like I mentioned, we don't see just a constant upward trend in these scores. There are several periods when we get discontinuities, when we get collapses in social development scores. You can see several very clear examples on this graph.
When we look back at the history of what happens when we get these great collapses in social development, every time we see the same five forces involved:
- Mass migrations that the societies of the day cannot cope with. This is always in the mix.
- The mass migrations often lead to huge epidemic diseases, as previously separate disease pools get merged.
- Epidemic diseases regularly killing half the population, it would seem, tend to lead to state failure. Governments cannot cope with catastrophe on this scale.
- The collapse of the governments tends to lead to breakdown in long-distance trade. Famines ensue, many, many more people die.
- And then, always there in the mix in some way, although it varies in every case, is climate change. It always plays into this.
Now, I'm sure you don't need me to tell you these are forces that plenty of people are talking about as threats we are facing in the early 21st century.
It seems to me perfectly possible that the 21st century is going to see another collapse of the kind we have seen so many times in the past. So in some ways it's possible the 21st century might be a rerun of what has happened many times before—but with one big difference: We now have nuclear weapons, which ancient people didn't have. The Romans would have loved nuclear weapons. Luckily, they didn't have them. I think if we do stumble into a collapse on the scale that I'm talking about here, we should seriously expect there is a possibility of these being used. It's quite possible that the 21st century will see a disaster that dwarfs anything we have seen earlier.
So I guess to me it seems that the implication of the social development index is that the 21st century is going to see more profound change than the world has ever seen before, although it is very hard to know what direction that profound change will take us.
To wrap up quickly, the claims I'm making:
I'm claiming that we can measure social development across thousands of years, as I tried to do in this graph. It seems to me it's always going to be contested and argued over, but that's okay because the errors I think are manageable.
The index I put together suggests, as a lot of people do, that the global power balance is shifting rapidly in the 21st century. It also suggests that the United States is likely to remain at the center of things for the next generation, perhaps for two generations, but probably not for three generations.
Also, I think perhaps most importantly, it suggests that history is kind of speeding up; the pace of change is just accelerating. The 21st century is going to be a kind of race between shifts in the balance of power, a transformation of humanity, and catastrophe. These are the three big things I think we'll see going on.
The scary part of the scenario is that great shifts like this have always in the past been accompanied by mass violence. I don't know of a single case where this wasn't true. This is what I am now writing a book about, a very cheerful topic, mass violence and its potential in the future.
So there is a lot to worry about. But I think there is also good reason to be optimistic about this story.
Humans have learned to manage an extraordinary array of challenges, including the mass violence, across the last 100,000 years. Your chance of dying violently today is roughly one-tenth of what it would have been if you had been born into a Stone Age society. We have learned to manage a lot of these problems.
Because of that, I am confident that the future is actually going to look like this, graph number 10 on the charts, the "onward and upward" version. I am confident that the future is going to be richer, safer, and more amazing than ever before.
I will leave you on that happy note. Thank you for listening.
QuestionsQUESTION: George Paik. A very, very interesting introduction to this work.
The graphs, in general, have a similar shape, and even a similar inflection point, to other graphs like population, global warming, et cetera. Given the number of new graphs that you have created with the same shape, I wonder if that spike makes for a difference in nature of how we might—as you say, transformation of humanity. I wonder if there are other criteria that maybe become relevant. I mean just thinking of words that get bandied around, words like "sustainability" or some of the criteria that Mr. Fukuyama has done in some of his political analyses, are there any candidates or not?
IAN MORRIS: Yes. Great question.
The reason so many of the graphs look sort of similar, with the great spike in the last couple of hundred years, is that I think there's a lot of redundancy between these different factors—like population growth, that has a lot to do with energy emissions and so on. So a lot of these things are in different ways measuring different slices of the same phenomenon, I think.
I think the big reason why we see the huge spike is the Industrial Revolution. We start to tap into coal and then oil. The amount of energy available to humans just explodes and everything changes.
Your question about does this change what we're looking at so much that it produces qualitative as well as quantitative change—yes, almost certainly the answer is yes. I think the question becomes sort of the "so what" question: How much does this affect what we are looking at here?
A lot of historians hate the kind of stuff I am doing here. My colleagues, all very polite people, of course would never say this, but they absolutely hate the sort of thing I'm doing here. The reason historians are often against a more social-science'y kind of way of looking at things is that historians will say that the numerical approach to things depends on your defining your terms and categories and you have to say exactly what you mean by X, Y, and Z, and then you measure them across time; and the historians will say, "You can't actually do that because the terms are constantly changing."
And so, like a social scientist might make a grand study of empire throughout history, say, a historian will regularly look at that and say, "Well, the Roman Empire and the British Empire are qualitatively different beasts. They can't really be compared in this kind of way. You can't bundle everything in together." Obviously, there's a lot of truth on both sides of this argument.
With what I have been doing here, I think that we can see constant changes through history in which of these different traits—which is sort of in the driving seat to some extent in social development. I think, particularly, this becomes a potential problem when you get really big changes in the score, like we got the last couple of hundred years.
I argued in my previous book, Why the West Rules—For Now, that geography had been the major driver behind what has been happening. I think what we are seeing now is change on such a scale that geography is changing its meaning so much that in some ways it is beginning to lose a lot of its meaning.
Obviously, if you are born in New York City or if you are born in the Congo, you'll know geography remains important, space is a very important thing. But on the other hand, when I came here the night before last, I took the red-eye from California and complained bitterly when I got here. I felt like death warmed over. But I got here in five hours. A hundred years ago, that would have just been unimaginable. The transformation of space has been just unimaginable. I think that is going to continue.
I was talking about discontinuities in the 21st century. I think change may well reach the point of speed and scale that just everything we have thought of as being the fundamental things in the human condition are going to change out of all recognition.
Sort of a long answer to that, but I think you are absolutely right in what you say.
QUESTION: Allen Young.
This is sort of a follow-up to your comments. You use the size of the city as a measure of organization. But one could argue that perhaps that may have been true up to now but, with information technology, people are going to be living in suburbs or exurbs, and therefore the size of the city in fact is a sign of lack of organization.
IAN MORRIS: Yes. That would be a great example of the transformation of those basic concepts here. Yes, it may be that designing indexes like this at just this particular moment in history will turn out to be a great joke in 20 or 30 years' time. People start getting interested in these things just at the point they cease to be relevant to anything.
It wouldn't be the first time. Thomas Malthus, the founding father of demography and large chunks of economics in a way too, figures out that it's impossible for the human condition ever to improve just at the point the Industrial Revolution happens. He is proved wrong even before he's dead—which is good company to be in.
But yes, with all of these traits, there are a lot of objections you can raise to them, a lot of room for debate.
I think with the city size as a proxy measure for organization, one of the obvious objections is, "Well, hey, go to Lagos or somewhere. This is not a model of organization"—which, again, obviously is true. But on the other hand, when you look at a city like ancient Rome—there were a million people living there, an absolute dysfunctional nightmare. But to have a dysfunctional nightmare with a million people took a level of organization that no earlier society was capable of. To have Lagos, which is 8 million people—a huge city—to have a city like that requires a level of organization that was impossible 200 years ago, say. So in some ways, even the slightly basket case cities people will point to, I think, do suggest that the correlation loosely holds.
But I think your point about it breaking down, I think this may well turn out to be very true across the 21st century. This I think again will be a classic example of the sort of thing about the changing nature of space and geography that came up in response to the first question we had.
One implication of these scores soaring up on this graph here is that by 2100 we will be dealing with cities of 140 million people. If you think in terms of New York City, 140 million people, it is very hard to imagine how that could function, but, of course, it may be that the nature of what we mean by a city will change so much because of new technologies that that's how we get to a place like that.
QUESTION: James Starkman.
Speaking of the collapse of social development which you referred to, if one simply substituted for the phrase "from Plato to NATO" with the phrase "from the Parthenon to Monty Python," or alternatively "from Aristotle to John Cleese," how could humanity ever recover?
IAN MORRIS: Recover from a giant collapse in the 21st century or recover from John Cleese?
That's a great question. That is what I think sometimes makes thinking about the 21st century a rather depressing and alarming business. I was trying to emphasize in the talk in some ways we can look at the 21st century as just being more of the same, more of the pattern playing out, the pattern we see going back for millennia. In other ways it clearly is not more of the same.
I would say one of the biggest differences is if you look back through history, up until fairly recently the world has been a pretty fragmented place, and societies in different parts of the world experience problems that are often similar to other societies. Like, say, go back a very long way, 10,000 years. You've got all these hunting and gathering societies. A lot of them are starting to experience a similar problem: their population grows very rapidly. As the world warms up after the Ice Age and the food base grows, so the human population grows. The human population outgrows the food supply.
The answer to this problem turns out to be the domestication of plants and animals. Some societies figure this out. Most don't, though. Probably 90 percent fail this experiment. Ten percent, or whatever the real number is, succeed. That 10 percent then basically takes over everybody else because their population grows so much.
A similar sort of thing happens again when you reach the limits of what an agricultural society can do. The answer is the Industrial Revolution. Most societies don't have one. A few do, they go on and spread out, take over the world.
In every case, most societies fail this test, have not innovated their way out of the problem. But in the very long historical run, it turns out it's not so very important. If, say, the British had not had an industrial revolution just before 1800, somebody else would have done, almost certainly, over the next 100 years or so.
I think the problem we've got now is that everything has gotten so tied together, our problems have become so global, it's like now we have whittled down all these experiments. It's just one big experiment. If we fail that experiment, the consequences may be catastrophic.
I guess you can imagine a world in which we somehow kind of muddle along, we fail to deal with energy emissions, growing population, we get famines and plagues and all kinds of nasty stuff; we can muddle along. I find it difficult to imagine us muddling along in that kind of world when we are armed in the ways that we are now armed. So my guess is if things go in the wrong direction, we are facing nuclear war.
The happy note, of course, is that for every 20 nuclear warheads in the world in 1986 there is now only one. We could not kill a billion people in a day anymore. Great news! It would take us several weeks to build enough warheads to do that—the not-so-great news.
So my sense of it is that a lot of the issue about solving the problems in the 21st century is going to become one about governance, about tackling global problems that nation-states are not very good at tackling by themselves. I'm confident we are going to be able to do that.
But if we don't do that, I think the outlook is extremely bleak. As you suggest, there might not be another round after Monty Python.
QUESTION: Susan Gitelson.
Now that we have been overwhelmed with these large trends, how about thinking about historians again? Historians like to emphasize heroes, and transformations could not have taken place without Genghis Khan, or Julius Caesar, Alexander, Napoleon, and so forth. So how do you reconcile the great man theory—and I hope great woman theory—with your general arguments?
IAN MORRIS: This is a question I was forced to think about as I've been writing these last couple of books. As you say, historians do normally focus on the individuals in history. In part, I think that's because of the nature of the source material we are working with, written by people, talking about people.
At one extreme you'll get people who say, "Everything is just about individuals; that's the only thing that's going on; this is all you should focus on, is the actions of actual individuals." The other extreme you'll get people who say—this is a favorite of Engels, Karl Marx's buddy—Engels's theory of history was that everything is driven by these mechanical forces; the individuals are simply not part of the story at all; we don't really have free will in history.
It seems to me that both of these extremes are wrong. Obviously we've got free will. I woke up this morning, I got to decide which socks to put on, all kinds of exciting things. Obviously we have free will. It's ridiculous to say anything other than that.
But what struck me writing the book was how rarely our individual decisions make a big difference to the larger story. All of the really big things, I think, have been driven by responses to more kind of material forces in the world—climate, geography, and so on. Of course it's individuals making the actual decisions—but we live in the real world, and you are always free to make a completely bizarre decision, but you will pay the price for that.
Like, say, I could decide right now I'm going to stop talking to you guys, I've had enough of this, walk out of the door, give up my job, and revert to hunting and gathering, like my ancestors 10,000 years ago. By the end of the week I'll probably be dead. I'll eat something that's poisonous, because I'm a terrible hunter-gatherer.
Throughout history people have had these options. But again, it's like little experiments getting replayed over and over again. The people who make decisions that don't accord very well with the material circumstances tend not to flourish. Those solutions to the problems drop out of the game.
The ones who make the decisions that do fit in with what is going on in the larger world, they flourish more. As far as I can see, it tends to be the boring people who make the right decisions, sort of plod on and everything works out.
As you say, every so often you get these people who explode onto the scene and do dramatic things. One of the things that surprised me in tracing this long story was how rarely these really big-name individuals—say 500 years down the road—how rarely what they did turns out to have mattered all that much.
Even somebody like Genghis Khan—there's lots of other guys rushing there out on the steppes invading China. He happens to be particularly good at it. But when you look and see where China is around 1600–1700, it seems to me it would have been in more or less the same place with or without the Mongol invasions.
These are things you'd want to argue about the details in particular cases. But the endpoint I came to was that of course the individual decisions matter, but they matter most on a short time scale, most on a relatively small scale. So what you do affects your family very much and then people further away a little less. The individual decisions matter least on the really, really big scale. That was the position I came to, anyway.
QUESTION: My name is Eugene Becker.
This is a very grim question for a spring Friday morning, but going back to your interesting points about the nuclear weapon situation, as I understand it—this is to give an example leading to the question—the Pakistan military has control over its nuclear weapons. The Pakistan military is divided into two groups, a pro-Western group and a silent group, supposedly, that has al-Qaeda connections. They have 35 of these bombs. The question I have is: How do we possibly avoid the possibility of accident?
IAN MORRIS: Yes. Like you say, a rather grim question.
I think here this issue about the scale on which we are looking becomes very important. A couple of years ago, when my last book was translated into German, I got invited to go over to Germany to give some talks about it. I'm not sure why they did that. I go over and I lecture in English because the book has just come out in German. It seemed bizarre to me. But anyway, they invited me to come over. It was in March 2011. The German publisher set up all these speaking things on TV and radio. It was all very exciting.
So I go to the airport and get on the plane. We land in Vienna first of all, get off the plane. By the time the plane has landed, there has been a tsunami in the Pacific and Japan has fallen to bits, thousands of people are dead, and the Fukushima reactor appears to be in the process of falling to bits.
First of all, all the TV and radio stations canceled all my interviews, because who wants some idiot talking about a history book. Luckily, I had a very good publicist in Germany who persuaded them that "No, this is an even better reason to have this guy come to talk to you about the long perspective." It turned out she was actually right for once in saying these things.
A pair of questions kept coming up.The first one was: "So does this mean that the rise of the East is now over because of this disaster?" Of course the answer is no, of course not. There were 16,000 people, whatever it was, who were killed in the earthquake and the tidal wave. But that, of course, doesn't mean that the rise of the East is over. This is a disastrous thing for people living through it, but it doesn't have that much impact on the broader pattern of development.
The other question they regularly would ask was: "So is this the end of nuclear power? Does this mean that nuclear power will now stop?" Again, the answer is no, of course not. It means you should not build nuclear power plants on fault lines—that seems to be an obvious lesson here; you should inspect the safety procedures on a regular basis and make sure everything works. That's another lesson. But it doesn't mean it's the end of nuclear power.
I guess I would say the prospect of, say, an Indo-Pakistani nuclear war or terrorist groups getting hold of Pakistani nuclear weapons—I would suspect that is obviously going to be a disaster on a much, much larger scale, several orders of magnitude larger. But it's unlikely, I would say, to change the overall pattern of global history.
The population of the world now is 7 billion people or so. Even if there were a war now killing tens of millions of people, it's unlikely, I would say, to change the larger direction that the world is moving in. Just like the Second World War killed between 50 and 100 million people, development scores soar across the 20th century; the trend toward power shifting toward the United States just accelerates because of this.
As you say, it's a slightly ghoulish question to ask, but an even more ghoulish answer to give, that when you step a long way back it's extraordinary how resilient human history has been to shocks.
QUESTION: Arlette Laurent.
What can you say about the acceleration of change and the impact on some people to adapt, or certain civilizations to adapt, to this acceleration, which you hadn't had 15,000 years ago, of course, but which we are faced with today?
IAN MORRIS: The question is about the acceleration in the pace of change and the ability of societies to adapt to these changes and to capitalize on them and so on.
I think a lot of the onward-and-upward effect of the graphs, swinging up so sharply, a lot of that I think is driven by the multiplication of humans. You go back, say, 10,000 years, you are dealing with a global population of not very many million people. Most people never encounter more than a couple of hundred people in their entire lives. There's just not that much interaction and exchange of things going on. As the world population has grown, I think that has had a lot to do with the speeding-up of the pace of innovations.
And then, of course, the innovations themselves feed back into the process. The classic example would be the Industrial Revolution. Once you have that amount of energy being harnessed by humans, being directed into food production, you need fewer and fewer people working on the land, more and more people doing other things, because the innovations then will start to feed off each other and we get the explosive growth we have seen in the 20th century.
I think you are right. Going back to the end of the Ice Age, we do see rising development scores. It's just it was so much slower in all periods of the past up until the present.
But with the ability to adapt, I think this is the really big thing that separates the humans from the other animals. I think in most ways most of what you want to know about human history you can explain by studying biology, not history. Most of what we do is just the same as what other animals do. It's just that we're much, much cleverer than them.
And we're much more flexible and malleable. Like, say, if you look at archeology, there are all these kinds of pre-humans, sort of human but not quite human, just about any of the Neanderthals, Homo Erectus. With pretty much any of them, wherever you excavate in the world, at whatever dates within the period these creatures existed, the archaeological record you find is pretty much the same. You look at a Neanderthal site in England and one in Central Asia, they're pretty much the same, they have one way of doing things.
We modern humans have multiple ways. We've got the big brain that's able to process and interact with the world in new ways and allows us to do all of these different things, allows us to create institutions that the other animals don't have, which again can adapt us to the world.
I think there's an enormous part for human creativity in this story, even though I keep emphasizing our interaction with material forces. The kinds of institutions we create, the kinds of cultures we create, some of them are more flexible and adaptable than others, obviously. Some of them are more suitable to the period they exist in than others, obviously. Nobody is making us develop one or another particular set of institutions.
Looking back across the history, what we see over and over again is that some societies, when the great challenges come, are better placed to respond. Like, say, in the 17th century in Western Europe, you've got much more open institutions in England and the Netherlands than you do in Spain or Portugal. In some ways, Spain and Portugal are actually better placed to capitalize on the new Atlantic economy than the English or the Dutch. But the English and Dutch react better; they catch up to and pass by the Spaniards.
So I think there is a great role in the story for the human ability to create and adapt and do conscious change. But I think, again, if we step back from the story, what we see is that when there are solutions to problems, humans in the past generally have eventually found them. They generally eventually do come up with the kinds of institutions and cultures they need to succeed—which is why I am kind of optimistic about the 21st century. It's all going to be fine.
JOANNE MYERS: Thank you once again for being with us and sharing this story. It was a great morning.


